
· shopify traffic no sales · shopify bot traffic · ecommerce conversion rate · shopify fraud analysis · store analytics
Shopify Traffic No Sales: Diagnostic Fixes
Fix your Shopify traffic no sales problem. Learn to filter bot sessions, diagnose funnel drop-offs, and clean your analytics for better conversions.
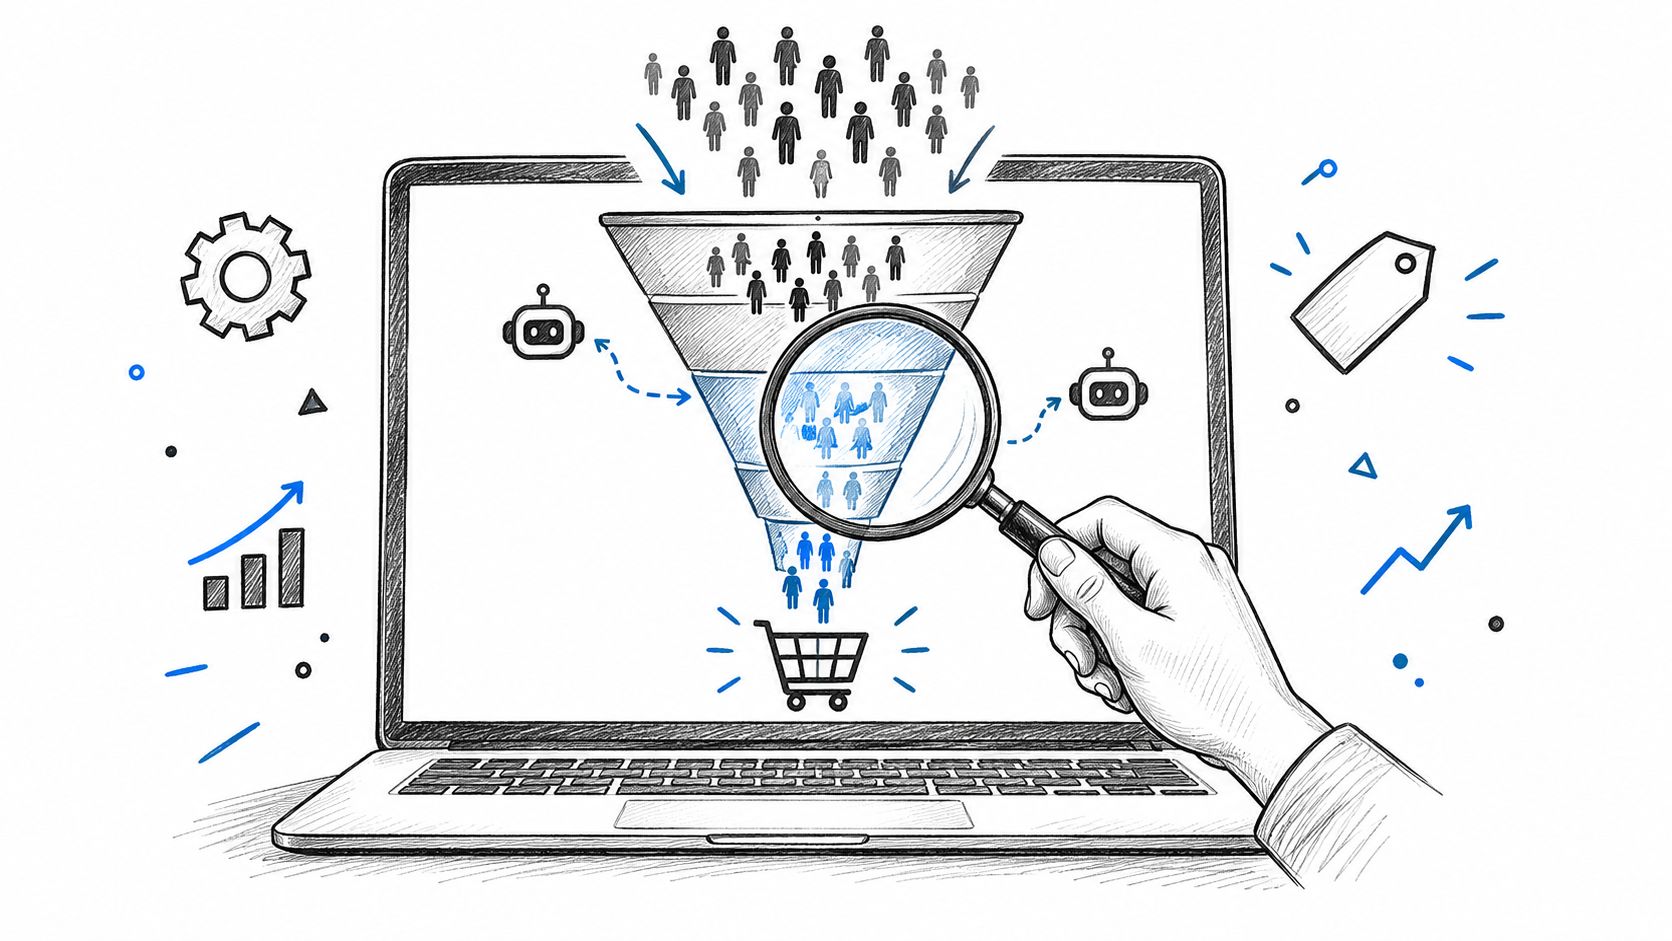
Most advice on Shopify traffic no sales jumps straight to product pages, pricing, or checkout buttons. That's too late for a lot of stores. If the traffic is polluted, masked, or misclassified, you end up optimizing for visitors who were never real buyers in the first place.
A cleaner diagnosis starts one layer earlier. Before you touch the storefront, separate genuine shopping intent from automated noise, then compare the cleaned traffic to your order data and only then decide whether you have a merchandising problem or a measurement problem. That's the difference between fixing the right leak and polishing a dashboard that was broken from the start.
Table of Contents
- Why Your Conversion Rate Looks Broken
- Filtering Bot Traffic from Real Shoppers
- Diagnosing Funnel Drop-offs and UX Friction
- Using Shopify Fraud Analysis Effectively
- Where Securify fits
- Common Questions About Store Traffic and Conversions
Why Your Conversion Rate Looks Broken
A healthy-looking traffic number can hide a weak sales engine. On Shopify, the median conversion rate across a benchmark of 426 stores was 1.4%, which means the typical store got one order for about 14 sessions, and half the stores did worse than that Littledata. The mean was 1.9%, which shows a smaller group of stronger stores pulled the average up.
The denominator is often the problem
That is why “high traffic, no sales” is such a sloppy diagnosis. If the session count is inflated by automated catalog research, scraping, referral spam, or other low-value visits, the denominator swells while the order count stays flat. The conversion rate looks broken even when the store is not attracting real shoppers.
Practical rule: do not interpret a conversion dip until you have checked whether the traffic is human, suspicious, or automated.
At the median rate cited above, 10,000 sessions would produce roughly 140 orders. Pull that same session count from a filtered traffic report, then compare it with the unfiltered view to see how much noise is padding the denominator.
For a useful framework on what to track once the traffic is cleaned up, use tracking ecommerce KPIs that matter instead of vanity totals. I also recommend a close look at how analytics noise hides real funnel problems if you are trying to separate signal from clutter.
Treat traffic quality as the first hypothesis
Before changing offers or layouts, ask whether the store is seeing likely buyers at all. If visits are concentrated in strange geographies, a few URLs, or repetitive patterns, the issue may be upstream of conversion optimization.
That is the part most merchants miss. They optimize the checkout while the core leak sits in acquisition quality and session purity.
Filtering Bot Traffic from Real Shoppers
Zero sales usually point to two different problems at once, traffic quality and data quality. Start by segmenting sessions by landing page, device, country, source or medium, campaign, and new versus returning visitor, then compare those groups against the product view, add to cart, checkout start, and purchase sequence. The pattern becomes clearer fast. Real shoppers leave a different trail from automated visits.
What bad traffic usually looks like
Repeated user agents, repeated IP patterns, abnormal geographies, and clusters of sessions hitting the same pages over and over are all warning signs. Bot-heavy traffic often shows shallow engagement, weak scroll depth, and little or no real product interaction. If JavaScript is not behaving as expected, the session mix may be padded by non-buyers.
Retail is exposed to this noise. Imperva's Bad Bot Report says automated traffic made up 51% of all web traffic in 2024, malicious bots accounted for 37% of internet traffic, and bad bots drove 33% of retail web traffic Imperva. Those figures are global, not a claim about every store, but they show how easily retail analytics can drift when automation gets into the sample.
Operational rule: a traffic spike that does not move product views or checkout starts deserves suspicion before it deserves budget.
If you need to stop that upstream, review how to stop bot traffic before it pollutes reporting. Bad sessions do more than fail to buy. They waste infrastructure, blur campaign comparisons, and make a healthy channel look weak.
Clean the data before you trust the dashboard
Before judging performance, exclude internal traffic, payment test orders, duplicate events, referral spam, and automated sessions. Then reconcile storefront analytics with Shopify orders and payment records for the same date range. If an order exists in Shopify but not in analytics, that points to a tracking defect. If sessions never reach product interaction, that points to a traffic-quality failure.
For stores dealing with abusive sessions or masked access, how to block suspicious shoppers on Shopify is a useful operational reference.
Diagnosing Funnel Drop-offs and UX Friction
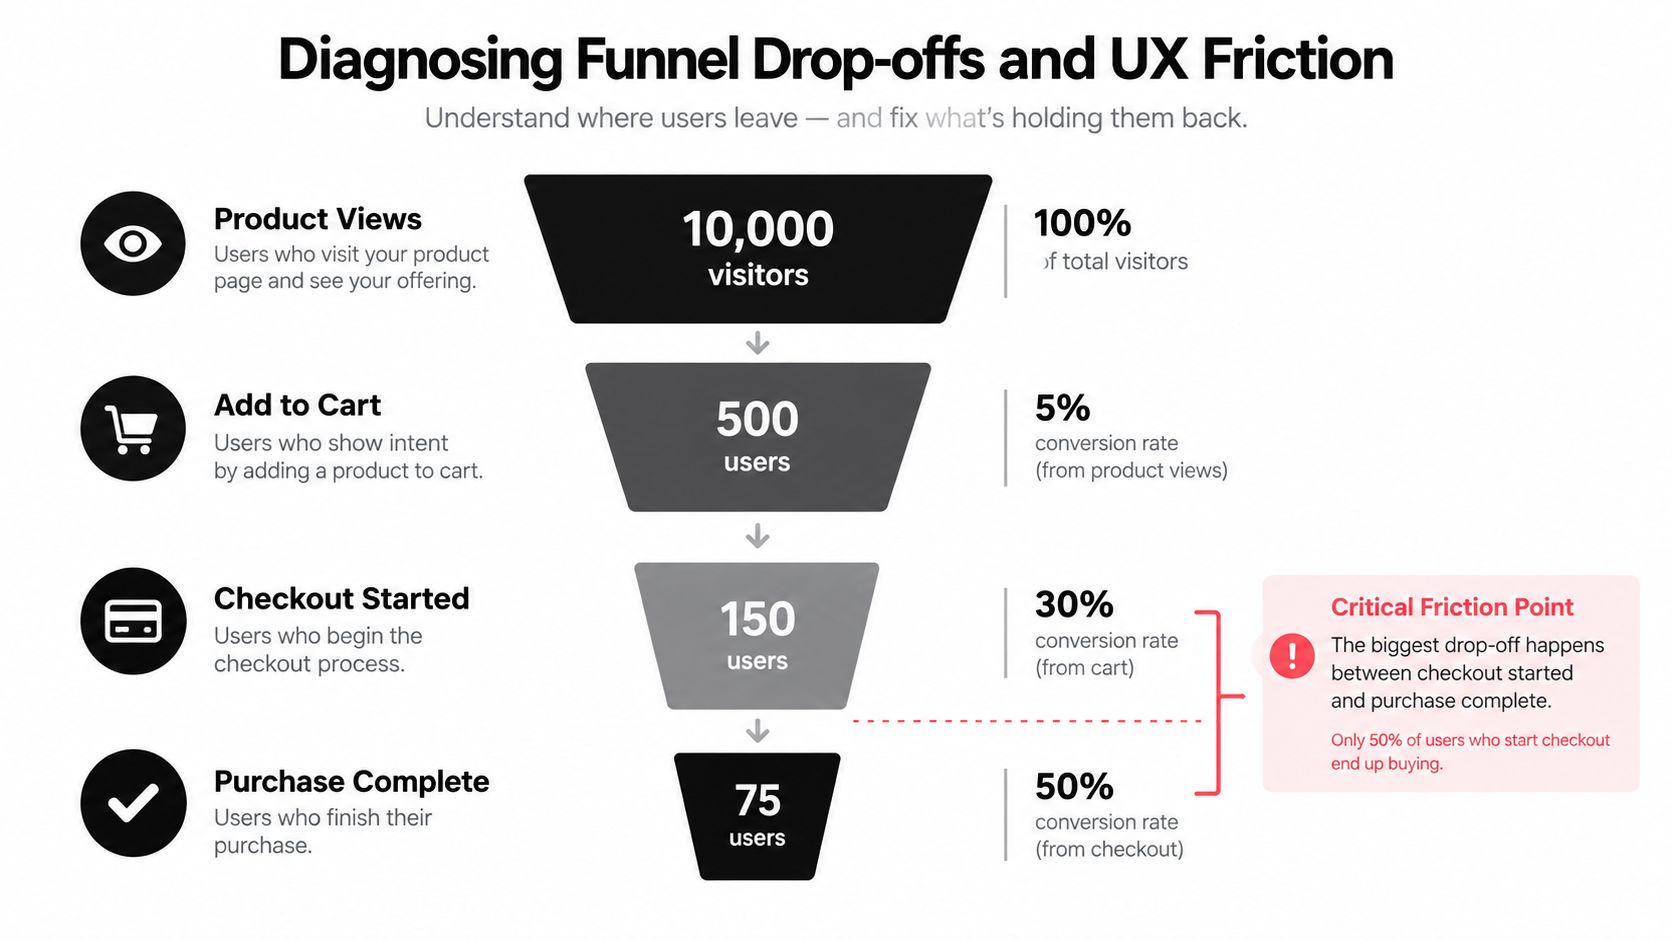
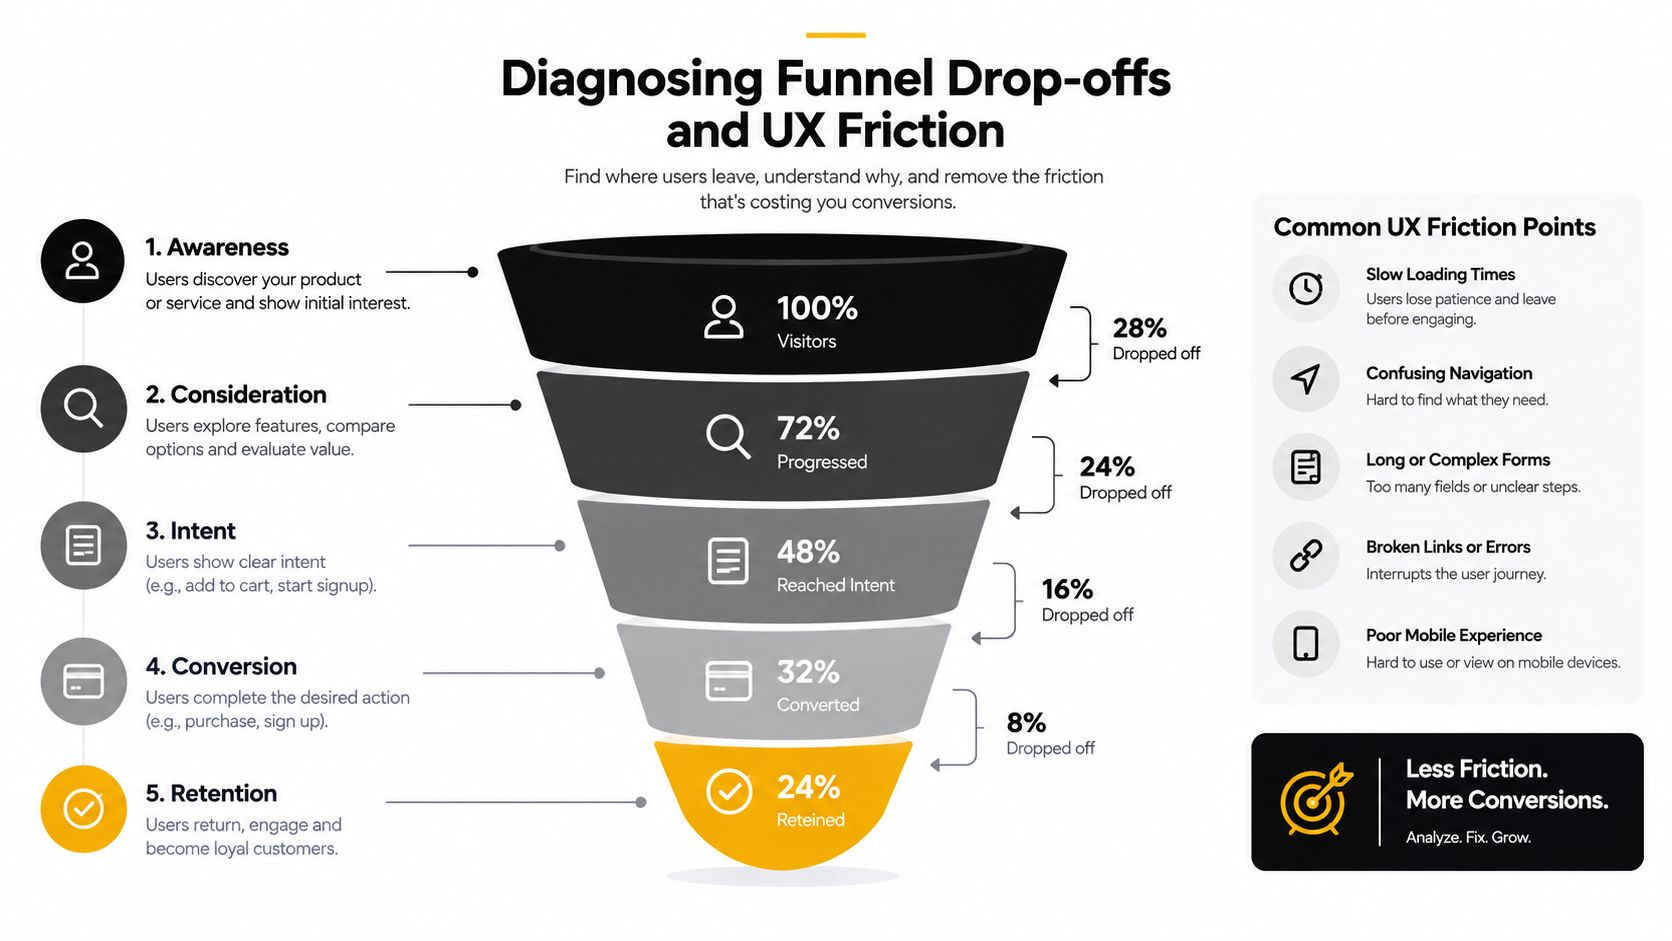
Once the traffic is cleaned, the leak usually becomes obvious. Some stores lose people before product engagement. Others get product views and still lose the sale at checkout. Those are different problems, and they need different fixes.
Read the funnel stage by stage
Compare product views, add to cart, checkout starts, and purchases in a controlled window. Don't blend campaign changes, pricing changes, and theme changes into the same review period unless you want a foggy answer. The stage with the biggest loss tells you where to work first.
If shoppers reach checkout and still abandon, that's a different issue from weak product interest. Baymard's research shows 70.19% of carts are abandoned globally, which is a reminder that checkout friction is common and session volume alone is a weak success metric Baymard. That doesn't mean every store has the same checkout problem. It means the checkout deserves scrutiny only after the traffic and product stages have been cleaned up.
For a practical breakdown of abandonment causes, 8 causes of checkout drop-off is a solid companion read. It's useful when you already know the loss is happening late in the funnel and need to narrow the friction points.
Reconcile analytics with actual orders
A common mistake is to trust one dashboard number and stop there. Shopify orders, payment-provider records, and storefront analytics should line up closely over the same period. If they don't, don't assume the business is failing. Assume the measurement is incomplete until proven otherwise.
Use a baseline window, annotate any campaign or pricing changes, and compare one stage at a time. If checkout starts are healthy but purchases are weak, that's a checkout issue. If product views are weak from the start, that's an acquisition or traffic-quality issue. A clean funnel gives you a clean decision.
Using Shopify Fraud Analysis Effectively
Shopify's fraud tools help you review orders after someone tries to buy. They're useful, but they're not a replacement for traffic control. They answer a different question, whether the order looks risky enough to review before fulfillment.
Traffic control and order review solve different problems
Shopify's fraud analysis combines indicators such as address verification, CVV, location match, device activity, network activity, and card usage patterns. It also warns that no single signal, or simple count of signals, determines the full risk level. Merchants should use the complete recommendation, not a single clue.
| Control Layer | Primary Function | Best Used For |
|---|---|---|
| Traffic control | Stop suspicious or non-human sessions before they distort analytics | Cleaning reporting, reducing noise, limiting upstream abuse |
| Order review | Evaluate risk after an order is placed | Triage suspicious orders before fulfillment |
| Payment and chargeback monitoring | Track disputes and fraud exposure over time | Watching downstream risk and operational cost |
Shopify also separates fraud metrics that answer different operational questions. A high risk orders rate is not the same thing as a fraudulent chargeback rate, and neither one is identical to overall chargebacks Shopify fraud reports. That matters because a store can have many flagged orders that never ship, or fewer flagged orders that still create costly disputes.
For a deeper native-tools walkthrough, Shopify fraud analysis is the right internal reference. If you're already seeing suspicious orders, shopify high risk orders helps put the review workflow in context.
Don't confuse risk review with traffic control
Order review protects fulfillment decisions. Traffic control protects the dataset before the order ever happens. That's the clean split. If you only review risky orders after checkout, you can still end up with polluted analytics, distorted campaign reporting, and a support queue full of noise.
Where Securify fits
Securify fits at the storefront layer, where suspicious sessions can be filtered before they pollute analytics or create extra review work. That makes it useful when you're trying to separate real buyers from bot traffic, VPN abuse, and masked access patterns. If you want to see the product listing, visit Securify on the Shopify App Store.
It works alongside Shopify's own order risk review, not in place of it. The operational value is earlier visibility into bad traffic, cleaner reporting for marketing decisions, and less noise flowing into email, support, and review systems. For stores that need upstream controls, that gap matters more than another checkout tweak.
Common Questions About Store Traffic and Conversions
Why do I have traffic but no sales on Shopify?
Usually because the traffic isn't as qualified as it looks, or because the funnel is leaking before the purchase stage. Start by checking whether sessions are human, suspicious, or automated, then compare product views, add to cart, checkout starts, and orders. If the traffic is clean, the problem is more likely in product presentation or checkout friction. If the traffic is noisy, the dashboard is lying to you.
Should I fix my checkout first?
Not unless the cleaned funnel shows the loss is happening at checkout. Shopify traffic with no sales can be caused by bad traffic, tracking defects, or weak product intent. If you skip the diagnosis and jump into checkout edits, you may solve the wrong problem and waste a lot of time.
Can proxy or VPN-heavy traffic affect my analytics?
Yes. Masked or infrastructure-based access can distort geography, source quality, and conversion comparisons. Shopify's fraud guidance treats proxy and hosting-company signals as review clues, not proof by themselves. Use those signals to prioritize investigation, not to make assumptions about every order.
What should I trust more, traffic numbers or order data?
Trust both only after you've reconciled them. If analytics says traffic is strong but orders don't appear, check tracking and order records side by side. If the order exists and the session doesn't, you've got a measurement issue. If neither looks healthy, the acquisition quality is probably weak.
When do native fraud signals matter most?
They matter most when suspicious orders start to show up alongside noisy traffic. Shopify's fraud analysis can help you avoid shipping orders that deserve a closer look, but it won't clean the top of the funnel. Use it for order review, not as a substitute for traffic filtering.
If your dashboard keeps showing traffic without sales, the fastest win is usually cleaner data, not a new homepage. Securify helps Shopify merchants block bad traffic, reduce analytics noise, and keep suspicious sessions from muddying conversion decisions. If you want to see whether your store's traffic is real or just loud, that's the first place to look.